When collaborating on a website redesign, I was faced with the challenge of measuring success without hard KPIs or conversion goals. Yet our project needed concrete goals we could point to and say, “Yes, this redesign worked!” Stepping back, it dawned on me that, frequently, the (re)design of a website may be disconnected from the business objectives of the organization. The result is a continuous, oftentimes monthly, data puke of Google Analytics metrics like unique visitors, bounce rate, pages per visit, average visit duration, percent new visits, and more.
No executive has hours to spend pouring over dashboards and numerous reports. But for companies that don’t sell goods or services online, connecting monthly traffic to associated campaign performance is nearly impossible.
This problem stems from trying to pull high-level insights from such a broad group (i.e., all of your traffic). On a broad scale, the aggregate traffic trends of all of your visitors are not going to change very drastically each period, presuming you keep most variables consistent (no drastic design changes, shocks to the marketing budget, etc.). The golden nuggets of marketing insight lie in tracking shifts of your most engaged users.
Step 1: Create Advanced Segments
For clients without hard and fast KPIs, I recommend tracking highly engaged visitors via Google Analytics custom segments. Google points us in the right direction with the built-in segment for Non-Bounce Visits. To go one step further, I also suggest creating two custom segments:
Engaged New Visits (click here to import)
Engaged Return Visits (click here to import)
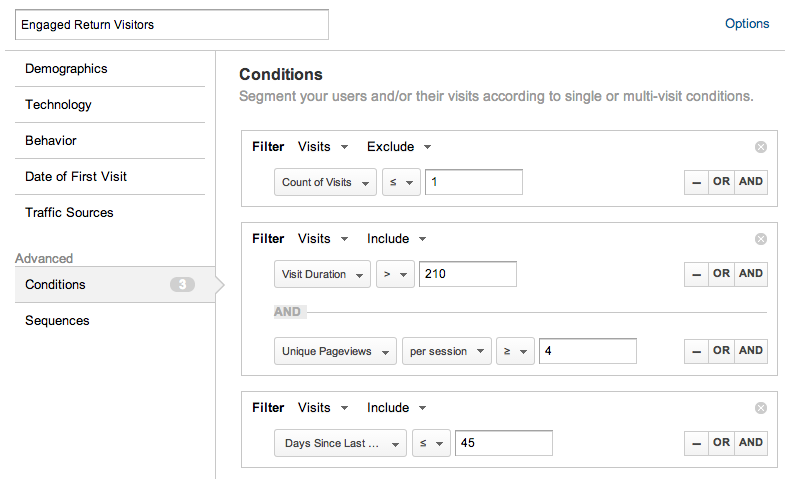
The conditions for these advanced segments are as follows:
Unique Pageviews per session ? 2x the Non-Bounce site average
AND Visit Duration > 2x the Non-Bounce site average (in seconds)
AND Count of Visits ? / > 1
[AND For return visitors: Days since last visit ? 30]
Depending on your site structure and content distribution, you may be more or less stringent in qualifying engaged users. For example, if you have fewer pages with rich, in-depth content, try longer time on site with fewer unique pageviews per session. Conversely, if you have lots of pages with less content per page, consider using more pages per visit.
Be careful when creating your conditions, as some visitor dimensions will limit your date range to 90 days.
For even better insight, add conditions to your segments for visits with certain events or interactions on your site that represent strong engagement, like downloading content, filling out forms or watching videos.
These two segments answer pivotal questions for non-ecommerce/SaaS sites:
- Are we growing the number of visitors that find value from our website?
- Are they coming back?
Step 2: Isolate & Decipher Your Segments
Since these subsets of traffic are probably a small fraction of overall web traffic, I recommend separating them from the default All Visits to easily pinpoint trends. Then, by viewing just one or two native reports in Google Analytics, these two segments will highlight which campaigns, sources, media or keywords are driving these engaged visitors.
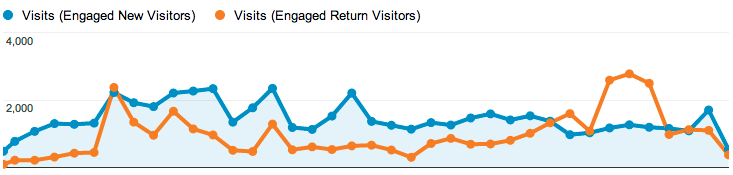
In the screenshot above, we can see several spikes in both engaged new visitors and return visitors. Sometimes, they coincide with one another.
For most websites, a suitable goal would be to steadily grow both of these segments over time. But be careful and keep an eye out for which content these users are viewing. For example, if a visitor comes to your site and spends a significant amount of time browsing your support forums, consider revising your conditions on these segments.
We like to use the engaged new visitors group to see if first-touch campaigns are targeting new visitors with relevant content. Maybe organic traffic provides engaged new visitors but our paid search campaign struggles. We would then look for ways to restructure our keyword bidding and placement strategy. Similarly, we look at engaged return visitors for some of our retargeting partners, as well as our own campaigns like email marketing.
Step 3: Track Meaningful KPIs
Now we can report meaningful indicators of success. Circling back to the tradition of month-over-month reporting, we can now track the period change of the raw number of these highly engaged visitors as well as their share of our overall traffic.
We then elect to use these new soft conversion goals in our reporting for clients. Even though Google Analytics limits engagement goals to one condition (for example, a marketer can qualify a goal by time on site or pages per visit, but not a combination of both) we can do a few extra calculations and understand these soft conversion rates per medium, source or campaign.
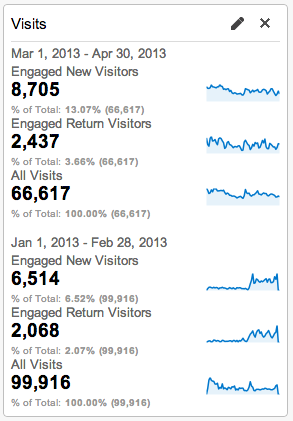
Here’s a screenshot from a dashboard: you can see in the two months after a website redesign, we saw a 33% decrease in traffic. But engaged visitors nearly grew to be nearly 17% of total visits compared to only 8.5% before the redesign.
If you want to try these segments out in your own reporting, be sure to import them from the Google Analytics Solutions Gallery, which is loaded with other users’ workarounds like custom reports and dashboards.